I’ve been obsessed with trading and investing in cryptocurrencies since 2013, and have learned which strategies work… And more importantly, which strategies don’t work. So in this guide, I’m going to show you my favorite trading strategy – Breakout trades! But before we dive into the details of the strategy, I want to explain WHY I like this strategy so much and what my primary goals are when it comes to trading cryptocurrencies.
Goal #1 – Trade Less, Profit More
I used to be a “day trader” in the old-school stock market… And I was miserable most of the time. My day consisted of sitting in front of a computer for 8-12 hours a day, laser-focused watching dozens of markets go up and down… And I felt like I was fighting elephants for peanuts. You see, no matter how many thousands of hours I invested into my trading strategies, I’d eventually get crushed by high-speed trading computers and big Wall Street firms. I made the mistake of believing that the more work I put in, the more money I’d make… But trading doesn’t work that way. The reality is – less is more. The #1 reason traders lose money is due to over-trading. You see, the only time you want to place a trade is when you have a higher probability of winning than losing. No trade setup wins 100% of the time, so your goal as a trader is to find those rare opportunities where the odds are in your favor. My big “ah ha” moment came in 2013 when I realized I could make more money by only taking a few trades a month in cryptocurrencies instead of taking dozens of stock market trades a day. As I talk about in this blog post, I completely changed my focus to wait for the big cryptocurrency trading opportunities to come along. From then on my motto was – Trade Less. Profit More.
Why Swing Trading?
“Day trading” means you buy and sell something within the same day. On the other hand, “swing trading” means you typically hold a trade for several days to weeks. In cryptocurrencies, I’ve found the biggest price moves typically happen over the span of 2-3 weeks. So instead of trying to make 2% to 5% on a day trade, I’d rather wait for a swing trade that shows profit targets of 30%+. Here are some of the main benefits of swing trading:
- Catch bigger price moves
- Less likely to get shaken out of a trade
- Fewer trades mean fewer opportunities for mistakes (technical or mental mistakes that can lead to mismanaging a trade)
- Less time spent in front of your computer
- More time to focus on other income or wealth building activities
Breakout Trades
In my opinion, breakout trades are the best setups for new traders for several reasons… First, breakouts have very clear entry areas. There’s no guessing when you should “pull the trigger” on an entry. Also, risk management is much easier than trying to buy a market that’s in panic mode and less risky than shorting a market that’s taking off like a rocket. So what exactly is a breakout trade? Well, a breakout trade happens when:
- The market starts with a clear trend (either up OR down)
- The trend is followed by a period of “consolidation”, or sideways price action
- Finally, price breaks through a resistance level, which creates a cascade effect of buying activity
Here’s why breakouts happen and why they lead to such big price moves…
- People start buying when they see price start to break through the price area
- Short positions start to close their trades with buy orders since the market is moving against them
- Anyone that was thinking about selling is more likely to cancel their sell orders
- Traders late to the breakout drive prices even higher (often times to our profit targets)
In other words, breakouts are self-fulfilling prophecies… Buying begets more buying, which causes more buying. This is REALLY simple, in theory… But not all breakout setups are profitable – Sometimes they fail. So the key is to spot breakouts you believe have a higher probability of leading to a “big move” in price. Here are some key factors that can increase the odds of a breakout winning:
News Catalysts
If price breaks a strong resistance area at the same time of a positive news announcement, that can lead to euphoric buying, causing a faster and more exaggerated move in price. A news catalyst could be any surprise announcement related to the cryptocurrency…
- Blockchain development announcement
- Endorsement or backing from a prominent entrepreneur or investor
- Positive relations with a government
- Increasing adoption rates or utility of the crypto-asset
- Mainstream media publicity
But keep this in mind – there’s a TON of useless noise in the media around cryptocurrencies. Most of what you’ll see or hear is either old news, unimportant opinions, or biased information with an ulterior motive. The goal is to see the signal through the noise and understand which news pieces could have a real impact on the perceived value of a market.
Longer Consolidation Patterns
As a general rule of thumb, the longer a market takes to consolidate prior to the breakout, the bigger the breakout can go. For example, I’d expect a 5-day consolidation to lead to a smaller breakout than a 6-month consolidation. You see, markets go through market cycles… And they need time to “relax” and build up momentum. I will usually trade bigger position sizes and set larger profit targets on multi-month breakout patterns, where I’ll do the opposite with smaller ones.
Risk Management Is Everything
Another reason traders lose money is because they don’t know how to manage risk. No matter what you’re trading or investing in, potential reward ALWAYS comes with risk… And the bigger the reward, the bigger the risk. People that buy markets without a plan are just gambling. The vast majority of rookie traders only want to focus on how much money they’re going to make on a trade… But savvy traders think even more about what to do if a trade does NOT work… Risk management boils down to 3 questions:
- Stops – where will you close your trade if it doesn’t do what you expect?
- Position size – how much capital are you putting into the trade?
- Targets – where will you close part or all of your trade if it does work?
A trader’s goal with risk management is to have a trading strategy that shows a positive expectancy. This means you expect to make money over time, not on every trade. Let’s look at a quick example:
- Assume you’ve taken 10 trades
- 6 profitable trades
- 4 losing trades
- Your 6 winners made $10,000 on average
- Your 4 losses were $5,000 on average
You would have ended up with a 60% win ratio, and a realized 2:1 reward-to-risk ratio (also knows as “profit factor“). In other words, you won more trades than you lost AND your average winning trade was larger than your average losing trade.
- Your total winning trades are +$60,000
- Your total losing trades are -$20,000
- Your net profit = $40,000
This means you averaged $4,000 profit per trade even though you only won 60% of your trades. If you know your strategy has a positive expectancy, you can stay confident when you encounter a losing trade. Unfortunately, most traders are undisciplined and won’t do this. Instead, they’ll panic when they lose a trade and start over-trading to make that money back… Which leads to a death spiral of bad trading decisions.
The 1234 Breakout Pattern
Now we’re getting to the sexy part of this guide… Technical analysis! The beautiful thing about breakouts is the technical analysis is easy to understand… And a breakout goes through 4 steps:
- It starts with a run in price that sets the trend direction
- Then we see a pullback in price on lower trading volume
- Price consolidates and eventually retests the resistance area
- Price breaks resistance area on high trading volume
In the chart below you can see two bitcoin breakout patterns from 2016: 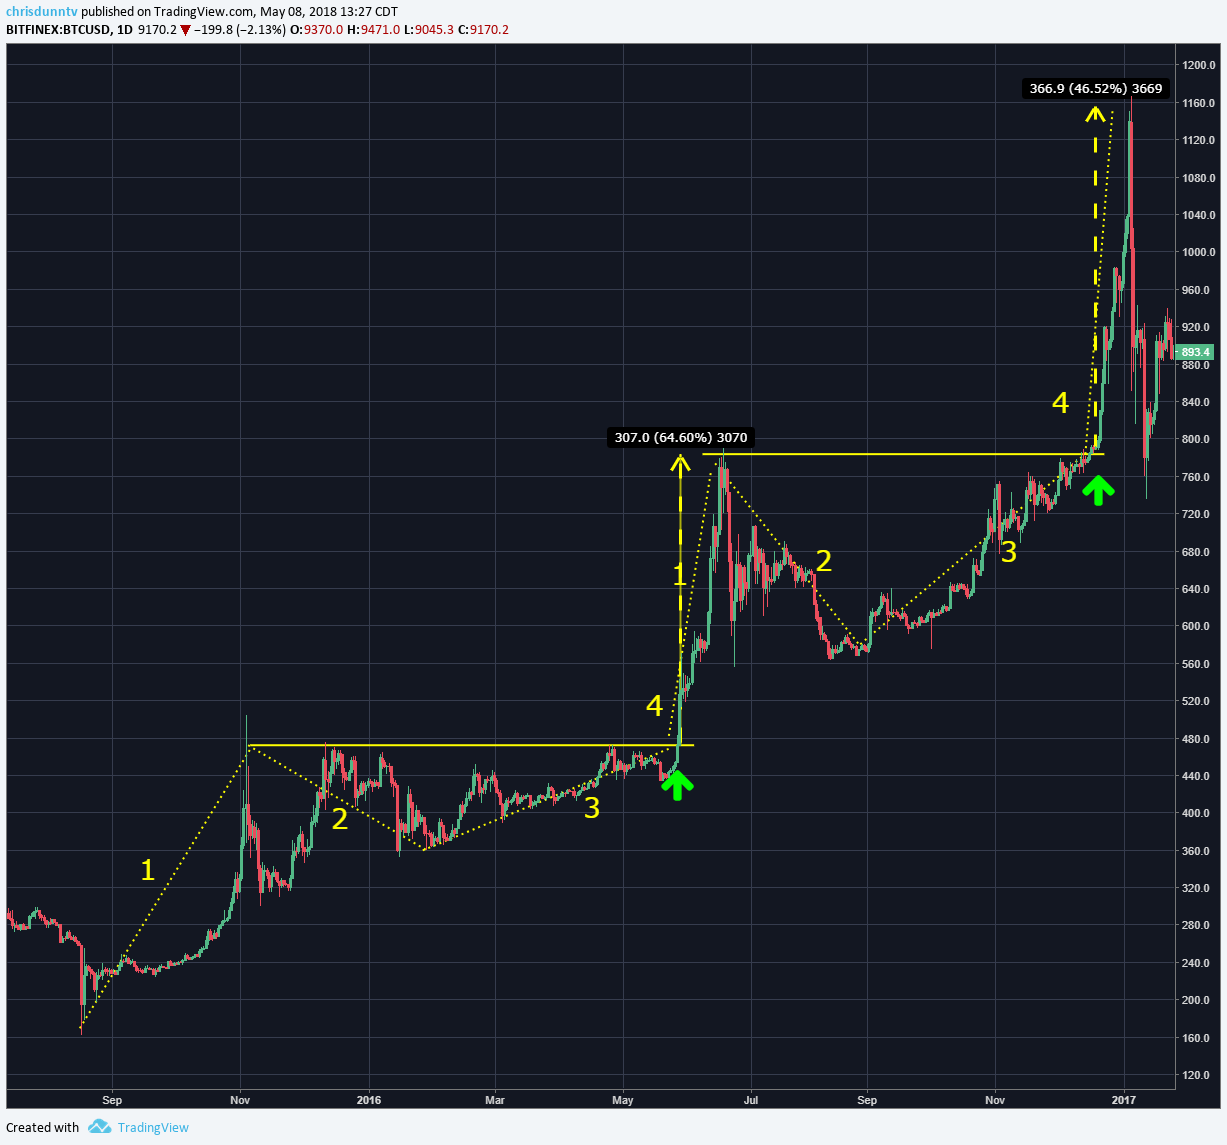 You can clearly see the initial runs to the upside in price with the yellow dotted line next to (step 1)… Then price pulls back slowly until it finds support (step 2), and retests the horizontal resistance levels at $480 and $800 (step 3). Finally, the buy trigger is a breakout of the multi-month resistance level. In these bitcoin trade examples, you can see they averaged about 50% gains on each breakout. Those are the types of trades I’m constantly hunting!
There’s More To Trading Than Looking At Price Charts
As fun as technical analysis can be, there’s more to think about outside of the price charts. Price charts are just a visual representation of the actions of all market participants. There are THOUSANDS of different indicators and tools you can put on a chart… But all indicators do is quantify price movement in different ways. There’s no charting tool that can accurately predict what the market will do with 100% certainty. I find the best opportunities when I combine the 3 different types of analysis:
- Technical analysis – How to keep it simple and not get fooled by random market price movement
- Fundamental analysis – Economics of the cryptocurrency
- Market sentiment – Understanding herd mentality, media attention, euphoria, and panics
Altcoin Breakout Examples
In addition to Bitcoin, we’ve also seen big breakouts on many of the most valuable altcoins like Ethereum and Ripple. Since 2016, we’ve seen thousands of new crypto-assets created, and dozens have achieved market capitalizations of over $1B. This explosive growth has given us many profitable breakout trades… And we send out trade alerts to our trading community to show what we’re trading and, more importantly, our thought process behind the trades.
Breakout Case Study #1 – Ethereum
It’s crazy to think we started trading Ethereum around $1.50, and it went over $1,000 in about two years! But in this example, we’re going to focus on the breakout trade from $400 to $1,300.
- In May 2017, Ethereum was trading around $100 and made a run to $400 (step 1)
- Then it consolidated in between $200 and $400 over a 6 month time period (step 2)
- It retested $400 in September but needed to consolidate for another couple of months (step 3)
- And in late November it finally broke out above $400 (step 4)
As we were planning this trade, we knew an entry at $400 would require a 30%-35% stop loss zone, and our initial profit target was around $800. That gave us a potential 3:1 reward-to-risk ratio (risking 35% to potentially make 100%). Ethereum ended up going way beyond our first profit target for a move and gained over 200% in less than 2 months, with a maximum reward-to-risk ratio of 6:1. 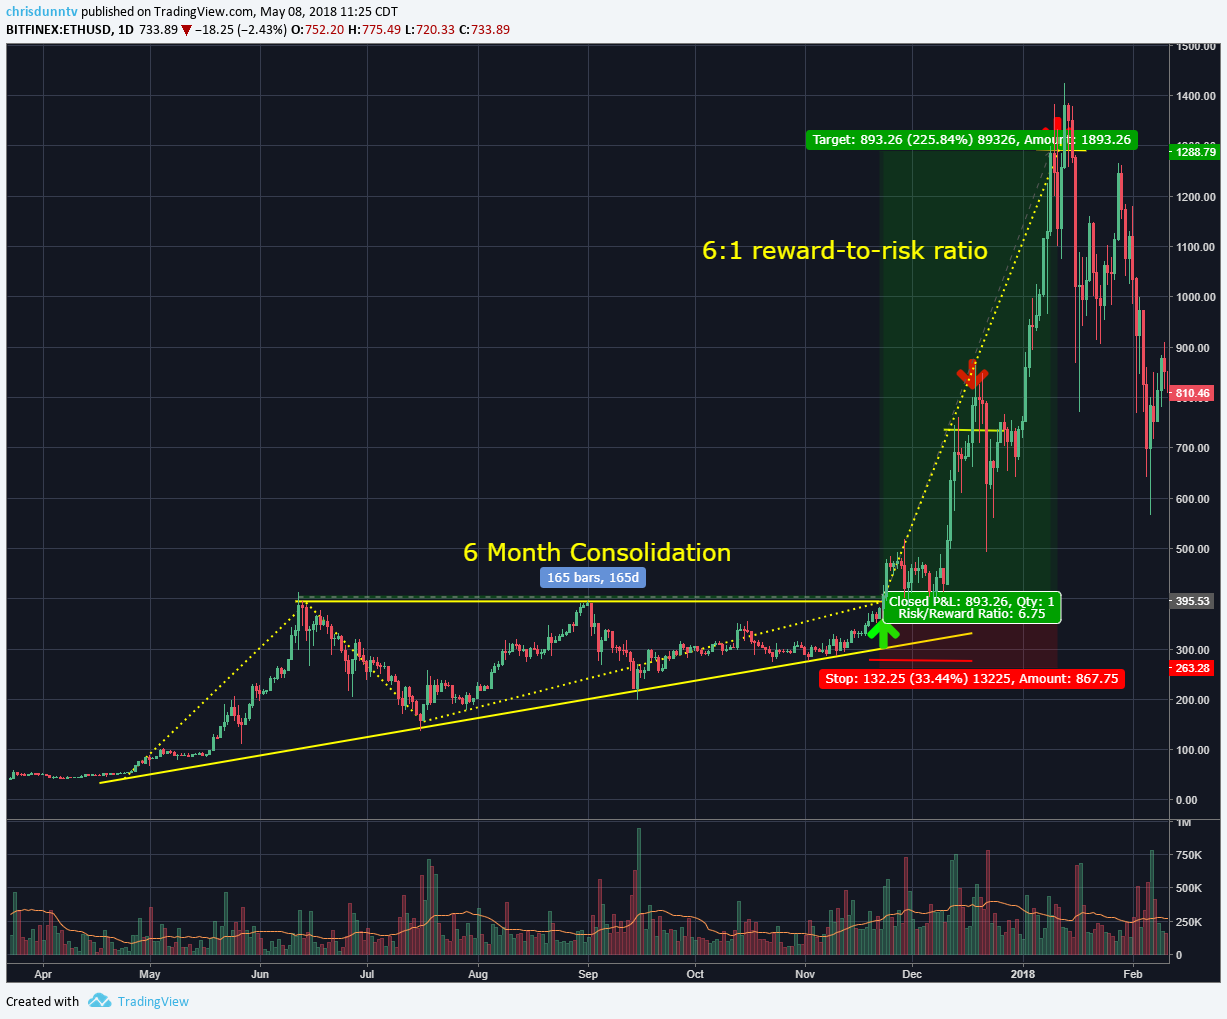 As the breakout started to trigger around $400, Rocky sent a trade alert to our trading community showing his first profit target around $800…
 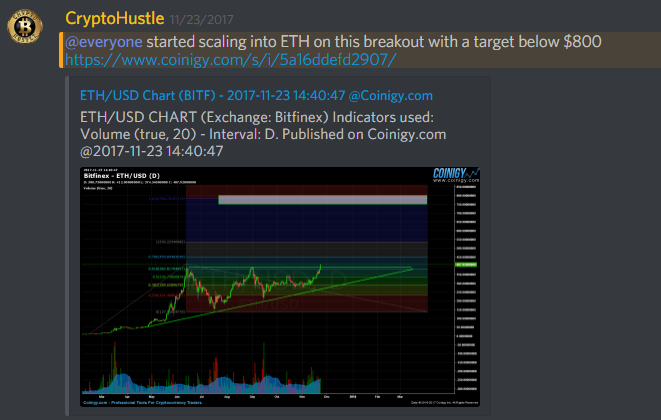 When it comes to trade management, I’m a huge fan of “scaling out” of trades… This means I like to close part of my trade at pre-determined profit targets, then reevaluate price action to anticipate how far the breakout will go. Sometimes I close part of the trade early, and sometimes I hold on too long… But the goal is to catch the meat of the move, not pick the exact top. Here’s another trade alert I sent out explaining my thoughts to our students, why I closed 20% of my trade in the mid-$700’s, and what I was expecting next:
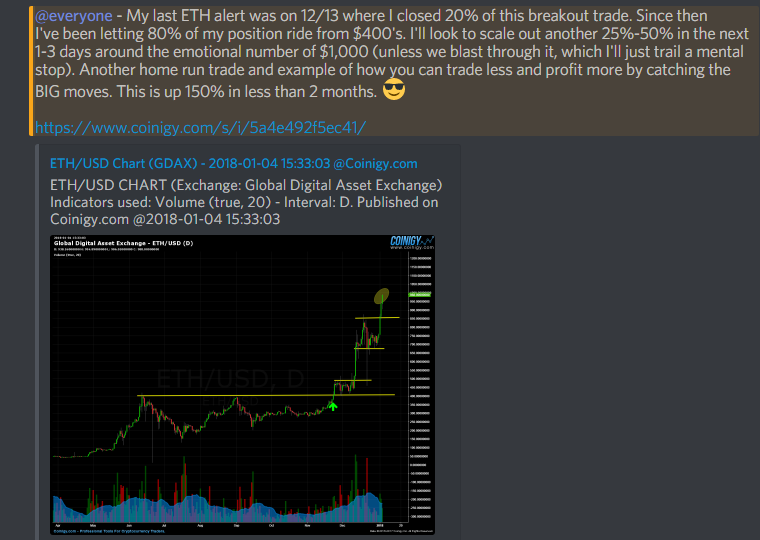
Breakout Case Study #2 – Ripple
Shortly after our Ethereum breakout, we started to see capital flow into many other of the top cryptocurrencies. We noticed a lot of hype building around Ripple, which isn’t exactly a decentralized cryptocurrency, but was a profitable market to trade nonetheless. We also knew that Ripple was the only top 10 crypto that was trading under $10 per coin at the time. You see, uneducated investors don’t pay attention to market capitalization… They just want to buy “cheap coins” so they can feel wealthy because they own thousands of them. For example, what sounds more impressive to talk about at your office’s water cooler? 1. I own one bitcoin (cost per coin = $10,000) or… 2. I own 10,000 Ripple (cost per coin = $1) But the price of a coin is irrelevant! A more important economic metric is its market capitalization, or the total value of all the coins in circulation. For example, if Ripple issues 1 billion coins and they’re trading for $1 each, then the total value of all coins (market cap) is $1B. If Ripple goes to $10 a coin, that would mean it’s market cap is $10B. The people who bought Ripple at $2.50 based on CNBC’s recommendation (see the charts below), did so without thinking about how much Ripple would be worth if it went higher than $3. This is how fundamental analysis and market sentiment helps us choose entry prices and profit targets… And why we were confident buying the breakout at $.30 and selling in between $1 and $3. 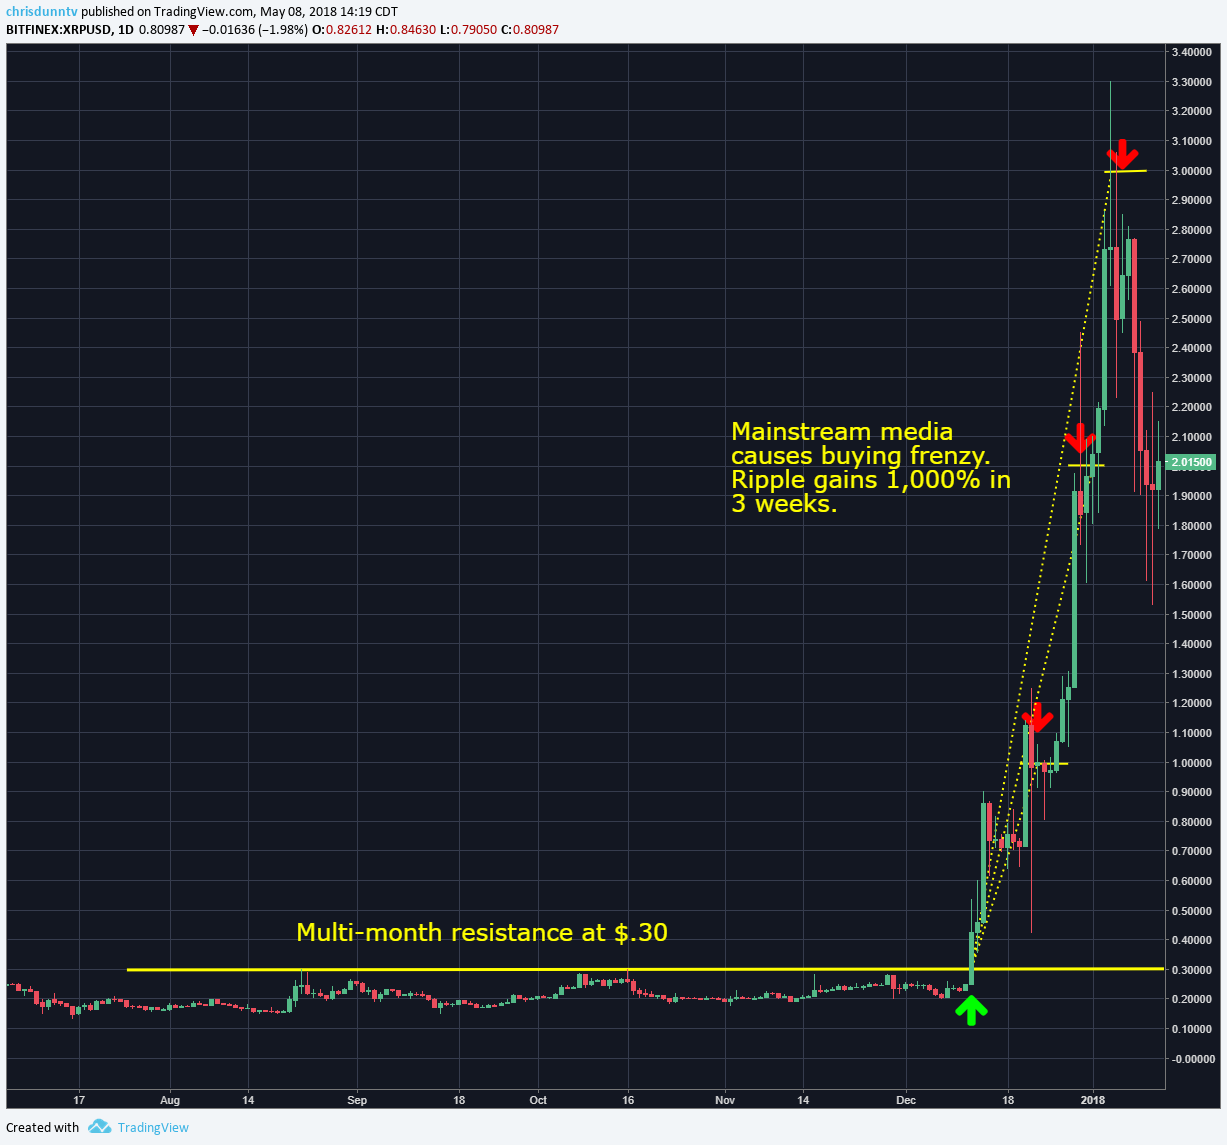 Here’s my trade entry alert at $.30 explaining my thoughts about WHY I was taking the trade…
 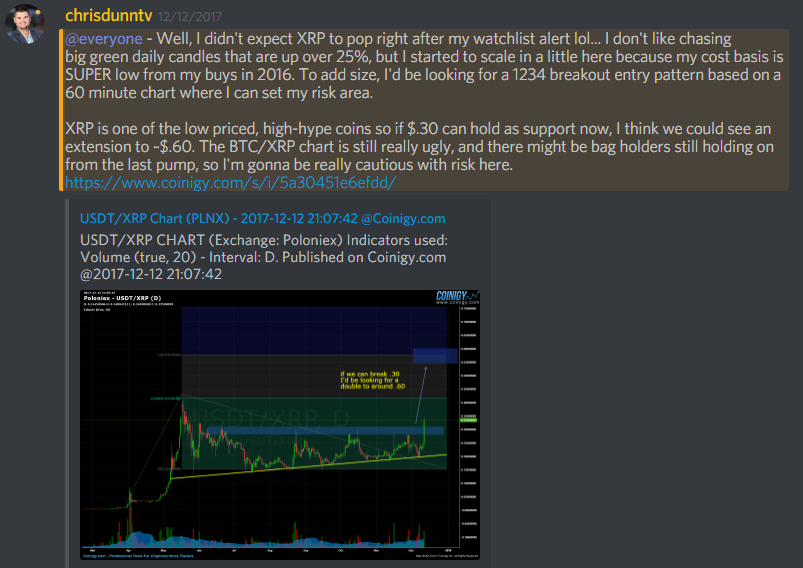 My initial target was only $.60 (100% gain), but I had a strong feeling it could go MUCH further… In the chart below you can see my thoughts on price targets, and why I had a strong feeling that CNBC would start “pumping” this coin to their viewers. That means they’d start encouraging people to start buying Ripple, show them how to do it, and talk about why it could be huge… And unfortunately, mom-and-pop investors around the globe put their trust in TV talking heads to make their trading decisions. It’s very sad, which is why I put so much effort into educating people how to do it the RIGHT way. But I digress…
 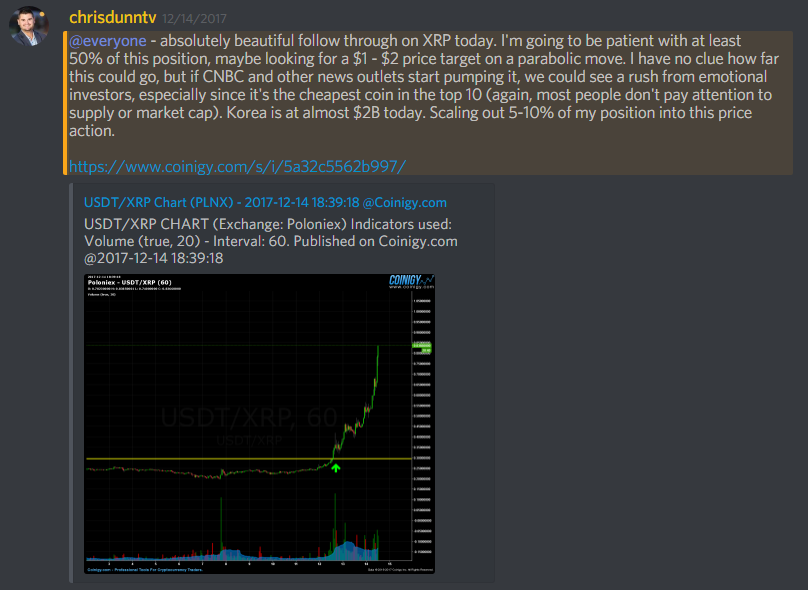 Sure enough, as soon as Ripple started to break out above $2, CNBC started responding to the increased demand by talking about how great Ripple was looking. You can see in this tweet from CNBC’s Fast Money that they were showing people how to buy Ripple after it had gone up about 800%…
Crypto class: @BKBrianKelly tells you how to buy #ripple $XRP pic.twitter.com/CG7TsI6ij7
— CNBC’s Fast Money (@CNBCFastMoney) January 5, 2018
And after it Ripple crashed, CNBC decided to air another show where they taught people how to sell at $.71… For a 70% loss! 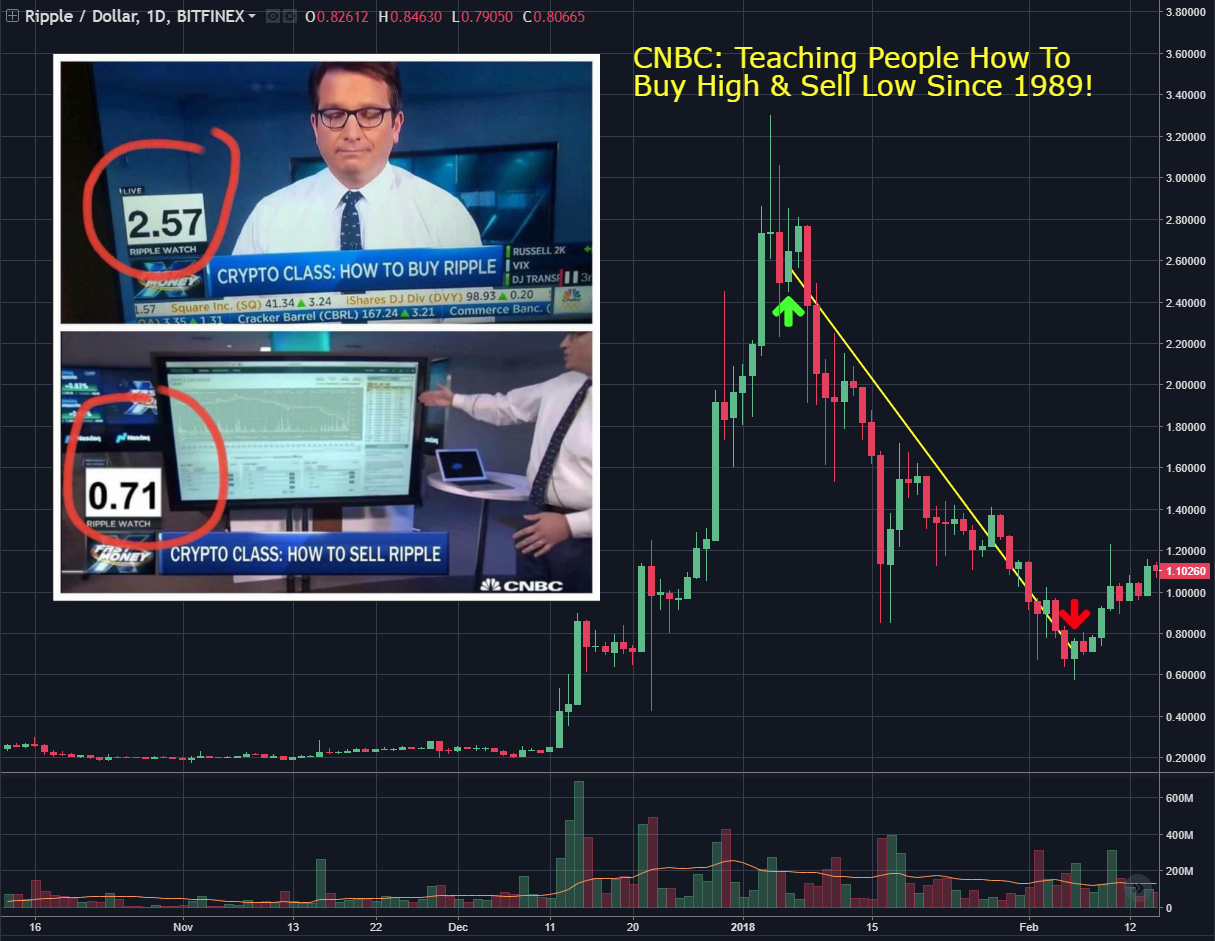 The lesson here? Do NOT trade or invest based on an excited TV news anchor.
Where to go from here?
My goal is to help 100,000 people learn how to become confident traders or investors. I began that journey by doing public bitcoin price predictions and crypto YouTube videos back in 2013… And wrote a book about bitcoin trading in 2015 (when bitcoin was at $200). If you want to learn more about how to trade cryptocurrencies, check out this free master class where you’ll learn more about our strategies. You can also join our premium community of crypto traders, investors, and entrepreneurs. Keep in mind, we are NOT a pump-and-dump group and don’t get paid to promote any cryptocurrencies… We’ve created a supportive community where people at all levels can support each other in their journey to their financial goals. I hope you enjoyed this trading guide, and I hope to see you in our community!