“Technical analysis” sounds scary for an incoming newbie to the investing world. It seems like something that only financial professionals do on a chaotic trading floor.
Technical analysis is nothing to be afraid to learn. In fact, it’s an essential tool for all types of financial markets, even if you’re just a mom and pop investor.
It refers to reading price charts for specific technical indicators. You can use these indicators to determine what Bitcoin’s price is doing right now, what it’s done in the past, and what it might be doing in the future.
The most common form of technical analysis is learning how to read price in the form of a candlestick chart. We’re going to find out what candlestick charts are, how to read them, and what you should be looking for to identify your next Bitcoin trading opportunity in seven easy steps.
1. Recognize Candlestick Charts
Also called a Japanese candlestick chart, candlestick charts were developed in the 1700s to track the price of rice in Japan. They consist of a series of small bars with lines at either end, looking vaguely like a candlestick with wicks at the top and bottom.
There are five main pieces of information in each candlestick, making them incredibly dense sources of cryptocurrency data. The lines at the top and bottom – aka “wicks” – represent the high and low prices for the day. The fat or graph-looking part of the candle (aka the body) represents the opening and closing price for the day on a given exchange. Finally, whether the candle is open or closed – or colored green or red – indicates whether the price direction that day went up or down.
In other words, an open or green candle indicates that the price rose during the day, and you can expect to find the closing prices at the top and the opening prices at the bottom of the body. A red candle or closed candle indicates that the price fell during the day, and you can expect to find the closing prices at the bottom of the body and the opening prices on the top. The lines or “wicks” always show the high price on top and the closing price at the bottom.
A great tool for reading different price charts is Coinigy. You can view candlestick charts on virtually any time frame that you need.
2. Dig a Little Deeper
In addition to the information contained in each individual candle or body, the chart will show the general direction of the market by placing each candle in a line. This is a little easier to read – if the line goes up, the price is going up. If the line goes down, the price is going down. There’s a bit more to it of course, but that’s a general principle.
The length of the entire candlesticks (wick and body) itself contains useful information. If it’s short, that means price didn’t move much beyond the day’s opening price. This means that there was a narrow range in price movement. The opposite is true if the candlestick is long. A long candlestick represents volatile price movement. These variations in the wick and candle body length create indicators that can be divided into two primary categories – bullish and bearish.
3. Types of Candlestick Patterns
There are many different characteristics of candlesticks that can be both bullish and bearish. Knowing how to read these patterns in price can help you quickly find trends.
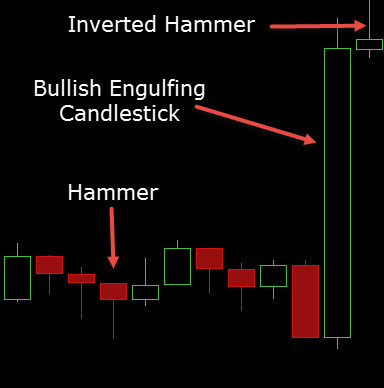
Engulfing pattern. This is a candle with a small body followed immediately after by a candle with a body that is larger on both ends of the spectrum from the previous day. You can see a bullish and bearish engulfing pattern.
Inverted hammer. The candle looks like an upside-down hammer, with a short, fat body and a long wick on top. This means that while price did reach highs during the day, sellers eventually pushed the price down into the close of the candlestick. This can be seen as bearish.
The hammer. It consists of a short, fat body on top with a long shadow underneath, looking much like a cartoon hammer. It is exactly the opposite of the inverted hammer. It signifies an opening and closing price that were relatively close together with a long drop in the price during the day. It’s usually a bullish signal as buyers are pushing the price higher into the close of the candlestick. This can be seen as bullish.
4. Consider the Chart as a Whole
Don’t get lost in the individual candlesticks, even once you’ve identified a clear bull or bear run. Take a wider view by looking at the price chart over a longer period of time. Cryptocurrencies, like all markets, have short-, medium-, and long-term aspects. Is your bull run just a blip in a much more significant downward trend? Could the bear run you confirmed be a short-term reaction to some bad news in an overall growing market? The big picture is important.
5. Learn as Much as You Can
We’ve just scratched the surface of the hundreds of technical analysis tools available. Remember, some folks hold advanced degrees in this kind of information. The casual investor probably doesn’t need that depth of knowledge, but it always pays to learn as much as you can. Frequent technical analysis sites and gain a stockpile of tips and tricks to use in your trading.
Technical analysis is a useful skill for identifying Bitcoin price movements. The mass of charts and graphs might seem confusing at first, but patterns will eventually become apparent. By mastering these patterns, you’ll gain an edge over less sophisticated investors and take your Bitcoin trading to a new level.